Personal Finance · Pie Chart Maker
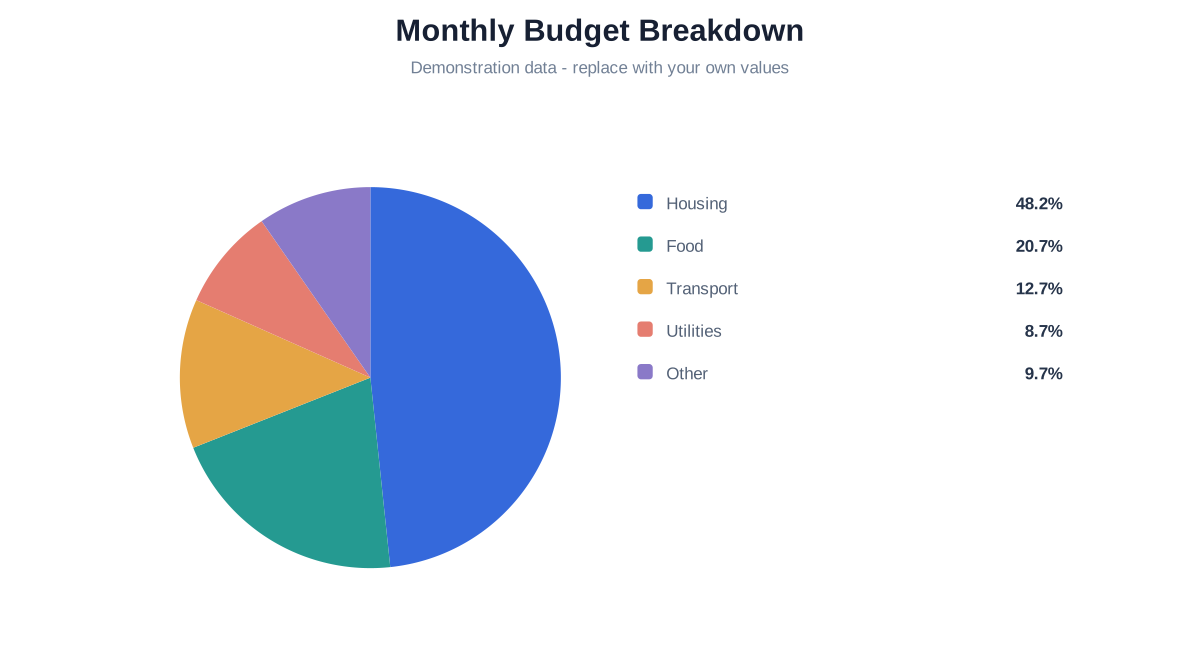
Monthly Budget Breakdown
See how several expenses divide one fictional monthly budget, then replace every category and amount with your own.
Open a real chart project, replace the demonstration data, and export the result. Every preview comes from the same renderer used by the editor.
See how several expenses divide one fictional monthly budget, then replace every category and amount with your own.
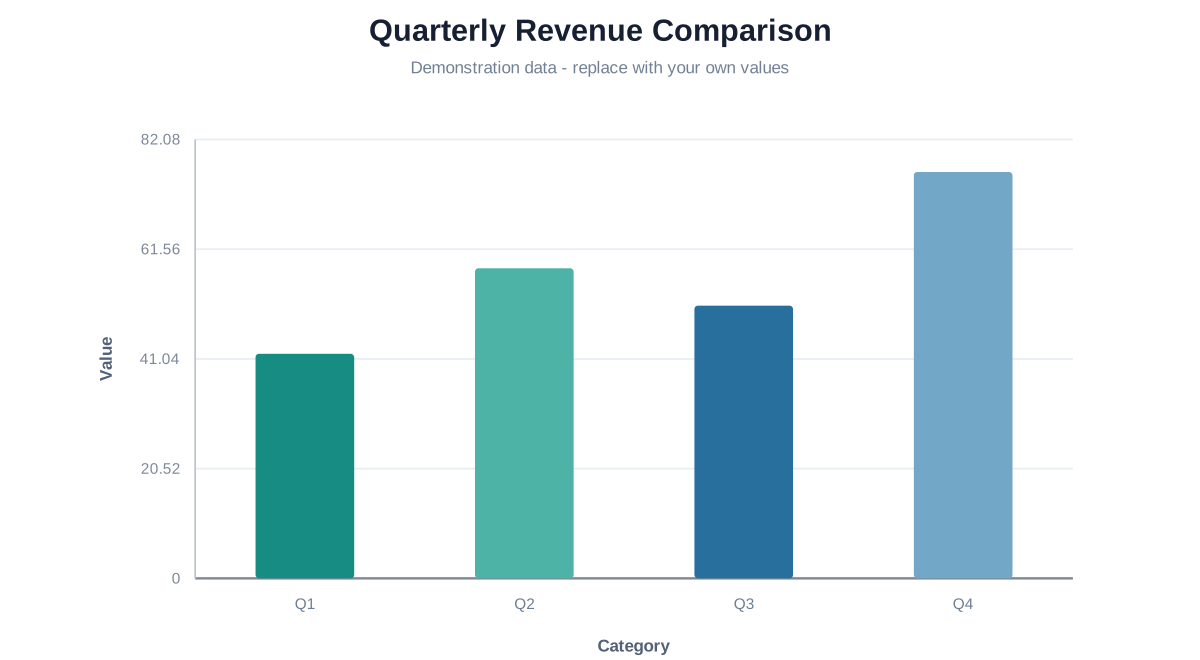
Compare four demonstration quarters on a common zero baseline and replace the values with figures in one consistent unit.

Follow a fictional sequence of monthly visits and replace the ordered observations with your own traffic data.
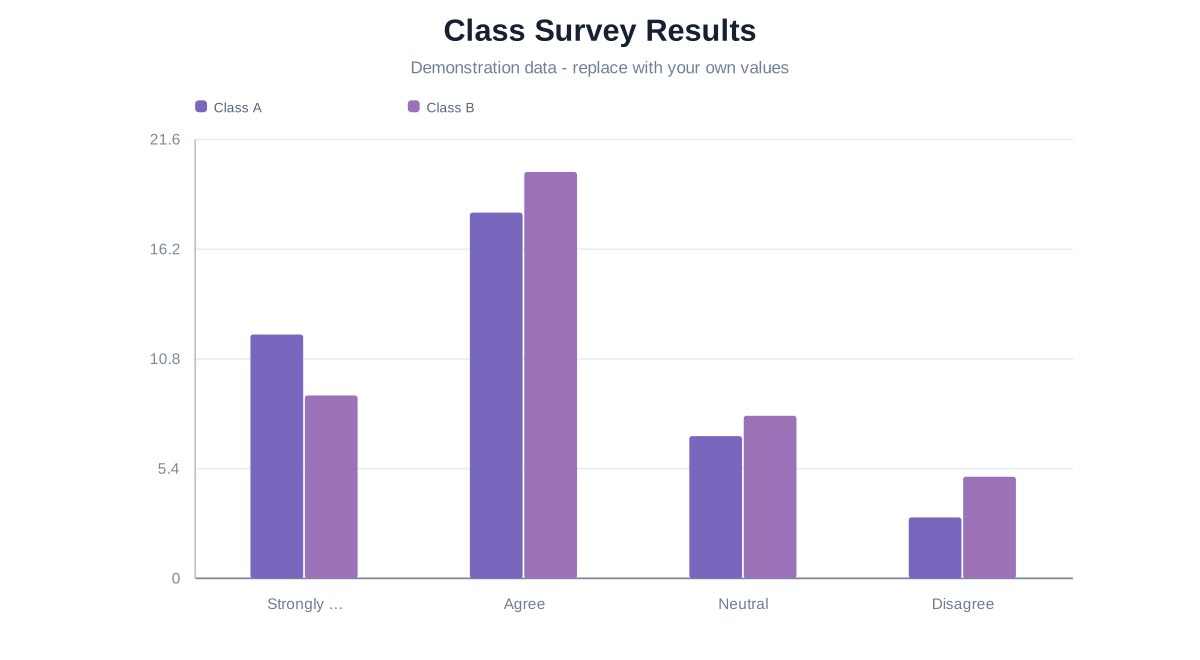
Compare two fictional class groups across the same response choices, with named series and a shared numeric scale.
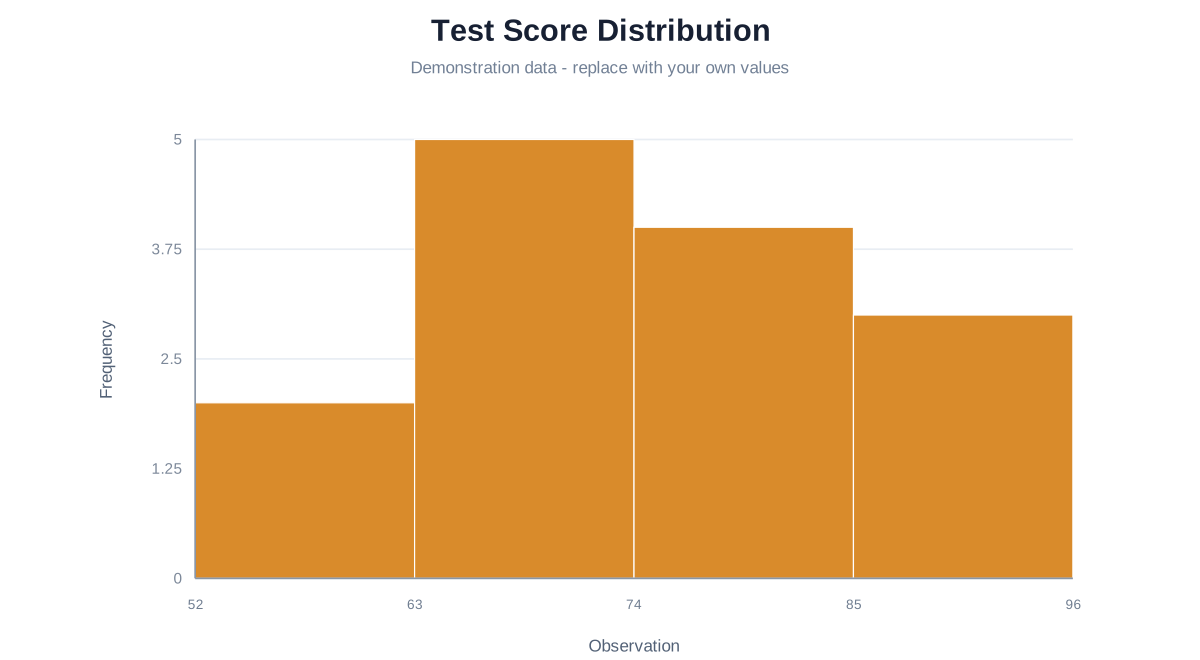
Inspect the shape of fictional raw scores. ChartMaker groups observations into bins; the source table intentionally contains no precomputed frequencies.
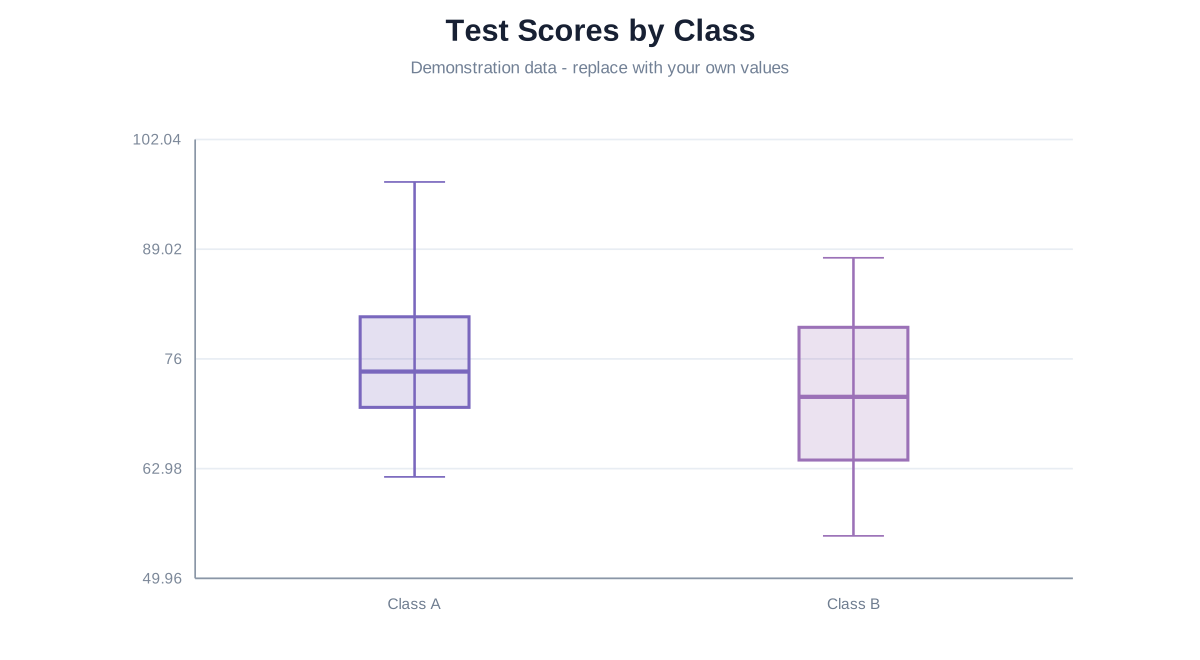
Compare the distribution of fictional raw scores in two groups using the renderer’s documented quartile and outlier rules.
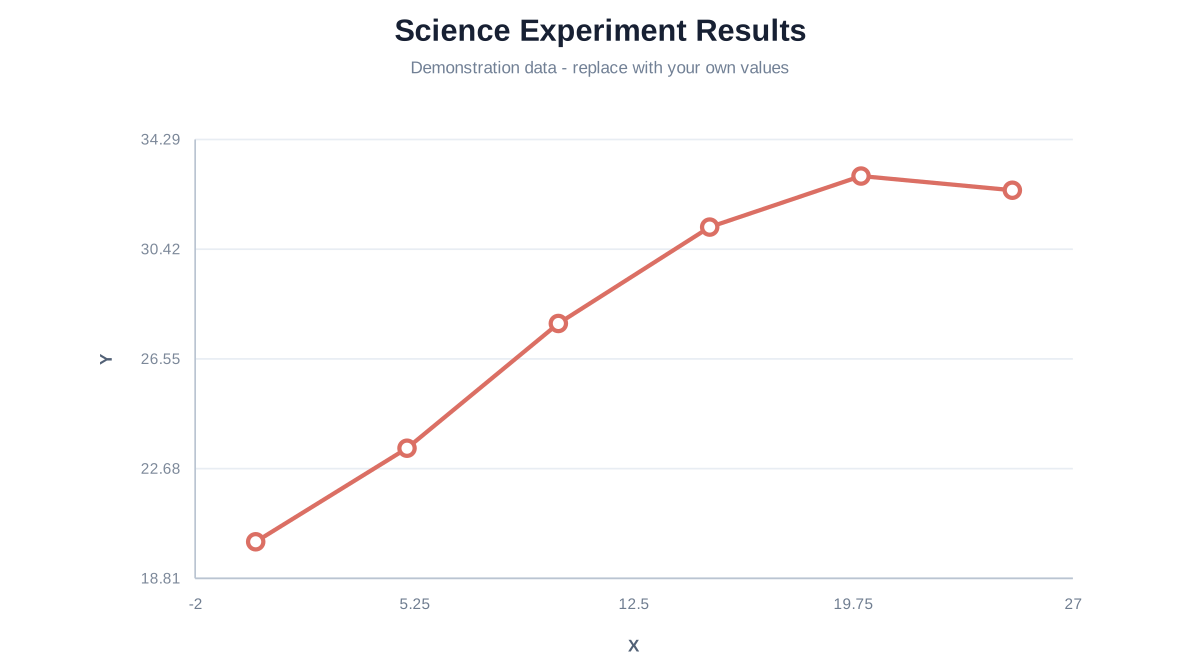
Replace the fictional step numbers and temperature measurements with observations from your own experiment, including the correct unit.
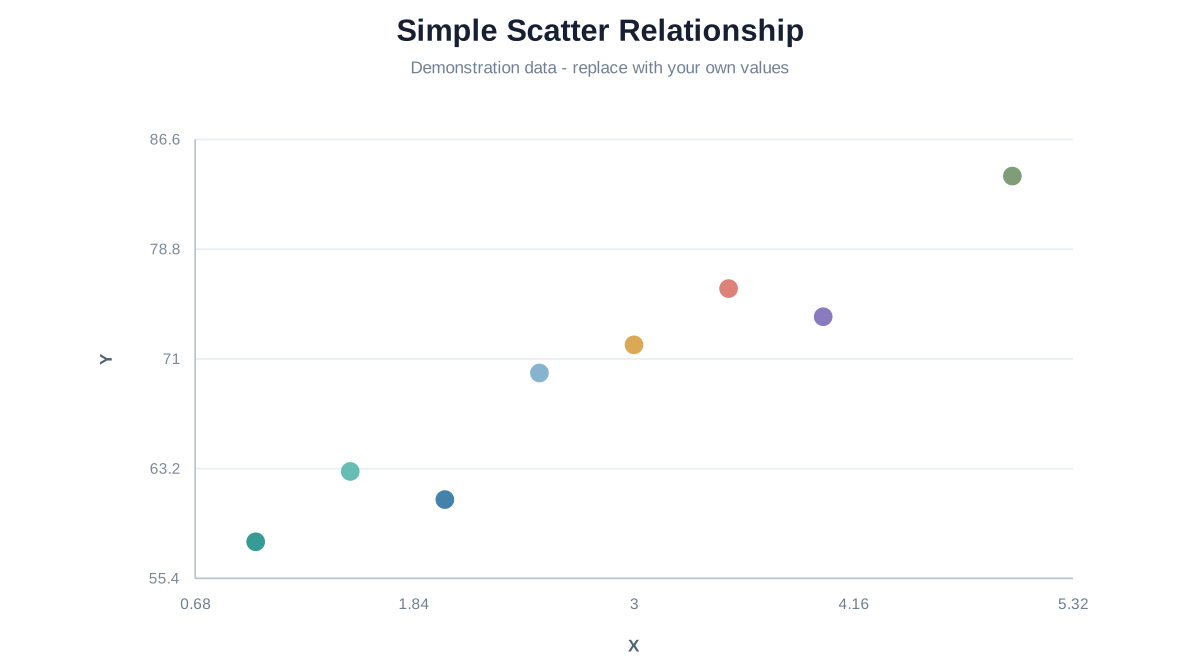
Explore how two fictional numeric variables appear together, then replace every X/Y pair with your own observations.
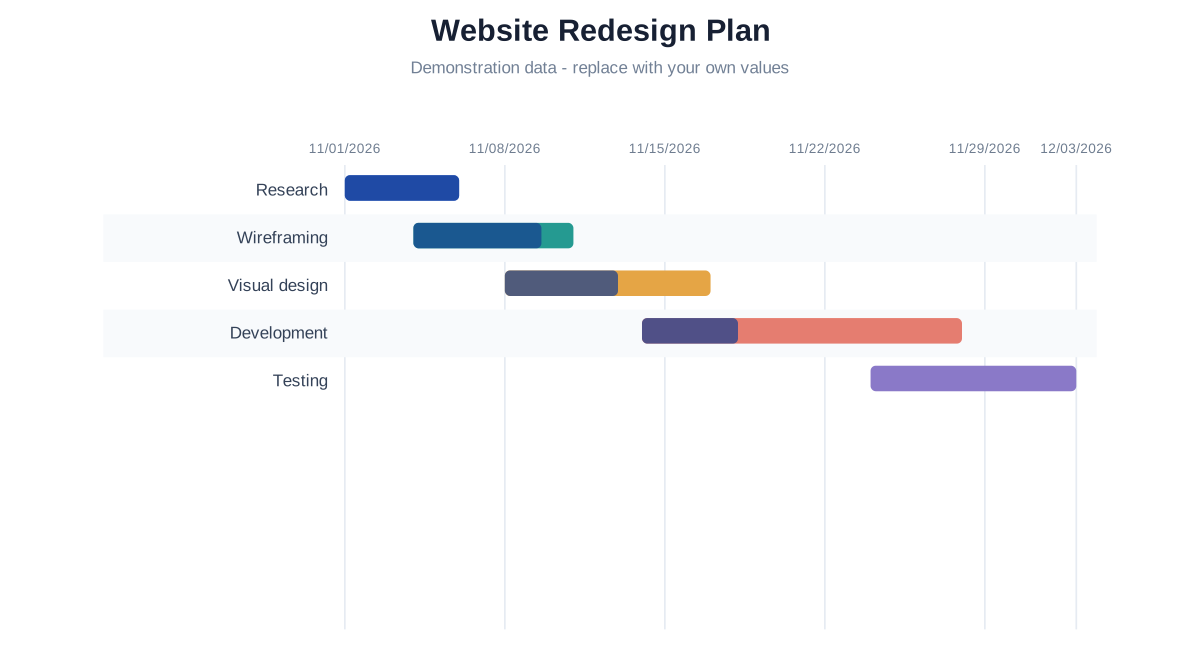
Plan a fictional redesign with overlapping tasks, inclusive start/end dates and editable completion percentages.
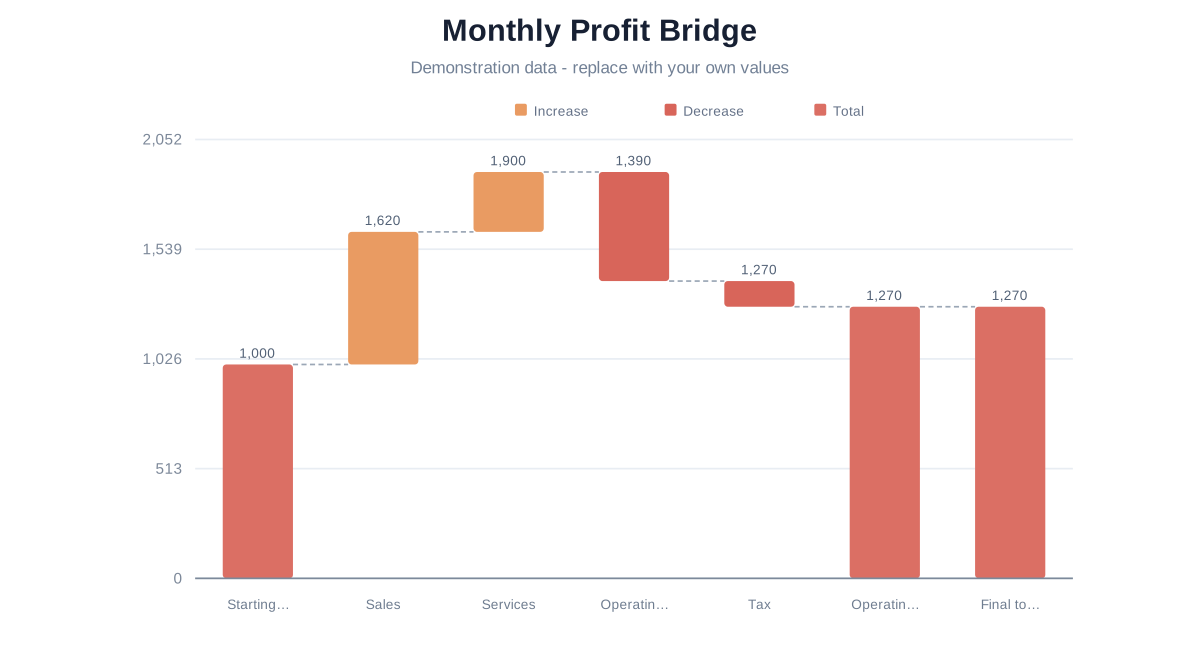
Follow fictional positive and negative changes from an opening value to an explicit subtotal and closing total.
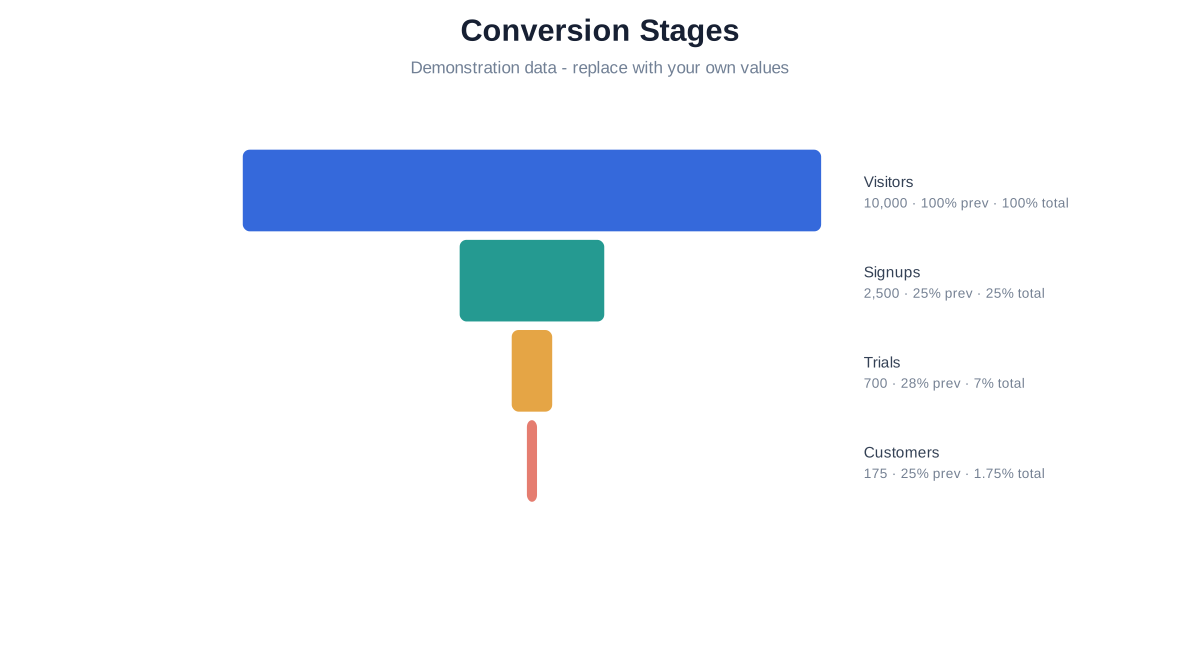
Replace four fictional ordered stages with your own non-negative counts and inspect adjacent and overall conversion.
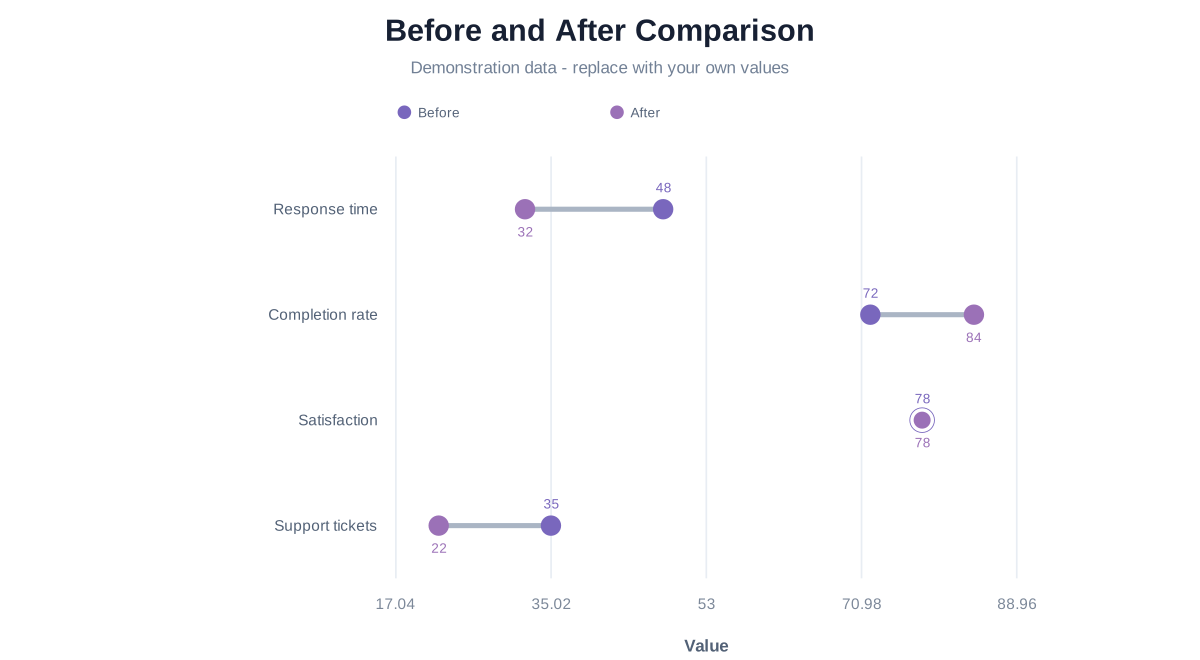
Edit paired values for each category and keep exact before/after endpoints on one common scale.