Preserve stage order
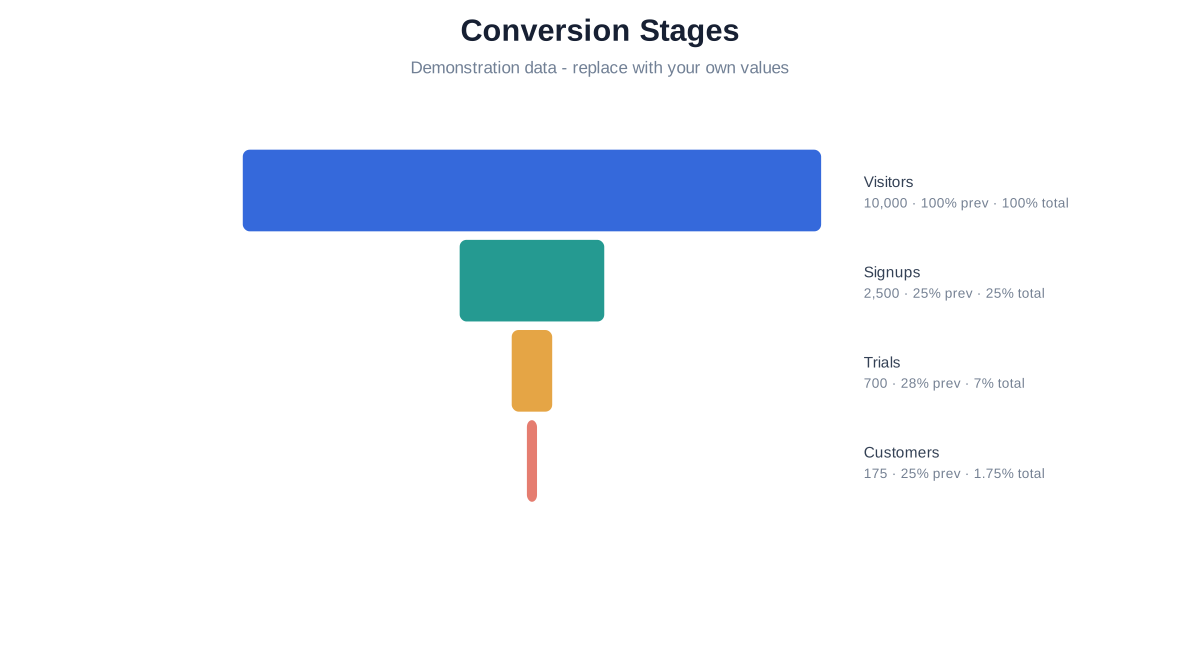
Rows stay in source order and every stage value must be non-negative. Width is proportional to value on one shared maximum.
Read two conversion measures
Adjacent conversion divides a stage by the preceding stage; overall conversion divides it by the first stage. Conversion after a zero preceding stage is undefined rather than fabricated.
Avoid process claims the table cannot prove
A funnel describes supplied stage counts. It does not identify causes, forecast outcomes or guarantee that every subject passed through each stage.
Start with a funnel chart template
Marketing · Funnel Chart Maker
Conversion Stages
Replace four fictional ordered stages with your own non-negative counts and inspect adjacent and overall conversion.
Related guides
CHART FAQ
Questions about funnel charts
Yes, but conversion from that zero stage to the next is undefined.
No; source order is preserved.