EDITABLE SCATTER PLOT MAKER TEMPLATESimple scatter relationship template
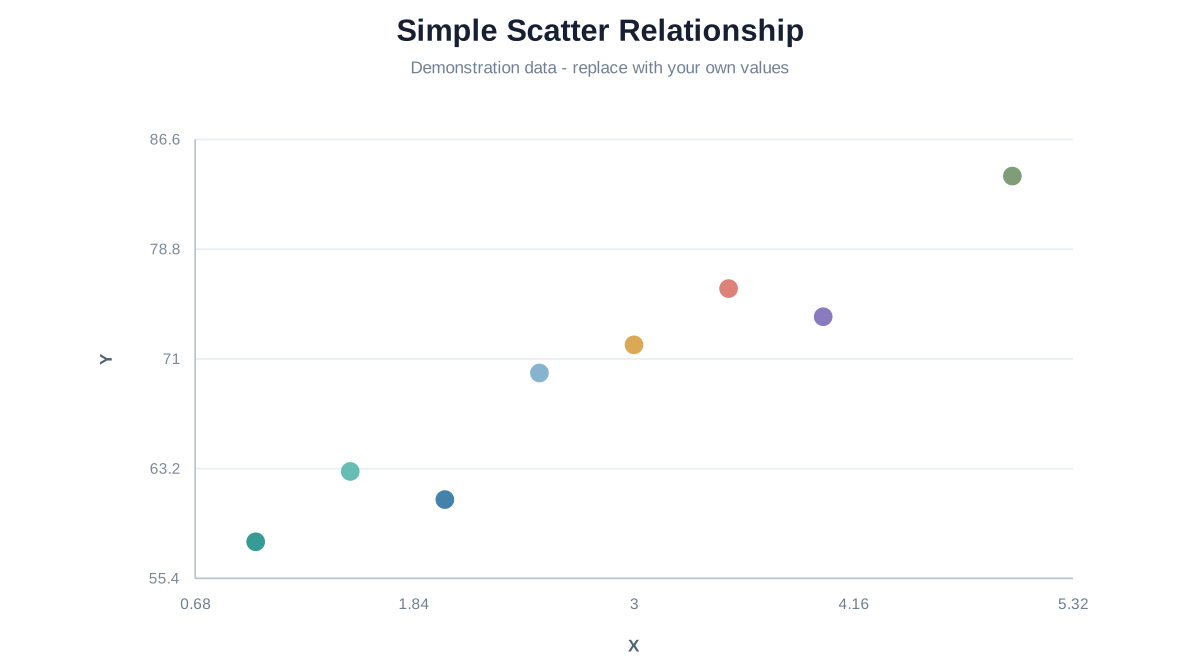
Explore how two fictional numeric variables appear together, then replace every X/Y pair with your own observations.
StatisticsOpen the complete editable project
Explore how two fictional numeric variables appear together, then replace every X/Y pair with your own observations.
Demonstration data: Fictional paired values; no causal or statistical conclusion is asserted.
Opens Scatter Plot Maker using one-time browser storage. Viewing this page does not change saved drafts.
SOURCE DATASample table
These are the exact values used by the preview and transferred to the editor.
| Study time (hours) | Score |
|---|
| 1 | 58 |
| 1.5 | 63 |
| 2 | 61 |
| 2.5 | 70 |
| 3 | 72 |
| 3.5 | 76 |
| 4 | 74 |
| 5 | 84 |
Inspect position, spread and overlap
Each row becomes one point using independent numeric X and Y scales. Coincident pairs remain valid even when one point visually covers another.
A visible association does not prove that changes in X caused changes in Y. Use a Bubble chart only when a third magnitude is genuinely available.
TEMPLATE FAQ
Using this example
No. It plots the supplied coordinates without automatic statistical inference.
No. Every pair is fictional demonstration data.