Compare series side by side
Every category receives an inner band for each series, so corresponding values share aligned baselines and remain directly comparable.
Use consistent series and units
Name every numeric column and keep units consistent. Too many series make groups narrow and the legend harder to follow.
Choose grouped or stacked
Grouped bars emphasize individual series; Stacked Bar emphasizes totals and contribution. Neither automatically implies a trend between categories.
Start with a grouped bar chart template
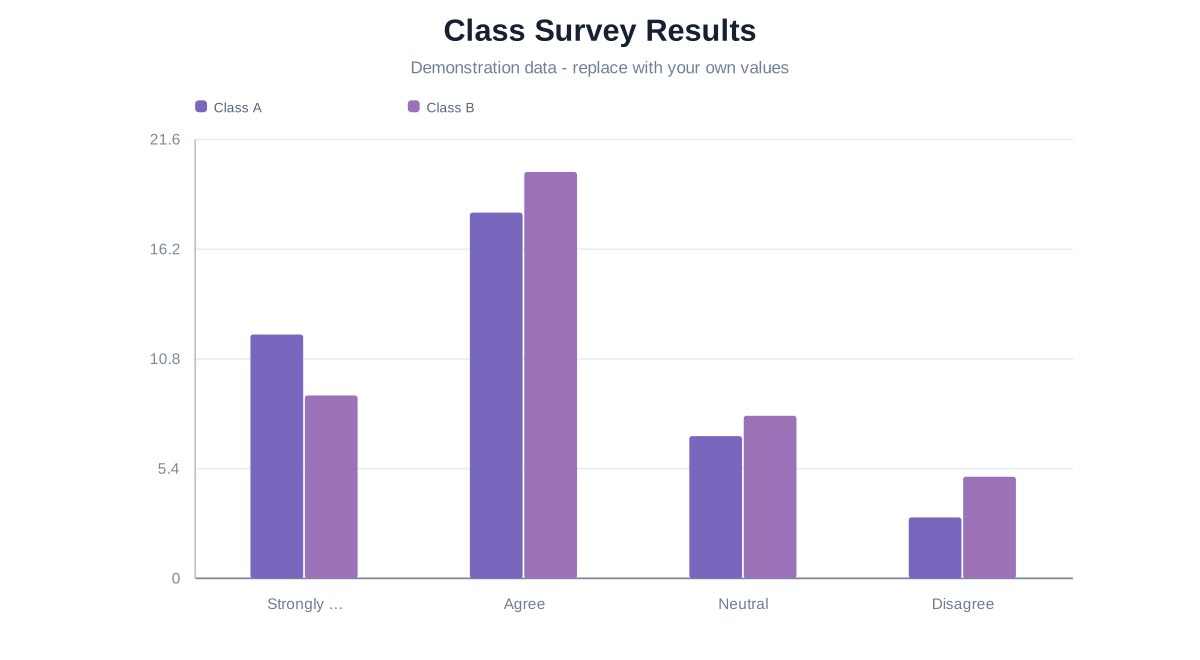
Education · Grouped Bar Chart Maker
Class Survey Results
Compare two fictional class groups across the same response choices, with named series and a shared numeric scale.
Related guides
CHART FAQ
Questions about grouped bar charts
The shared model supports up to ten value series within the project limits.
Yes.