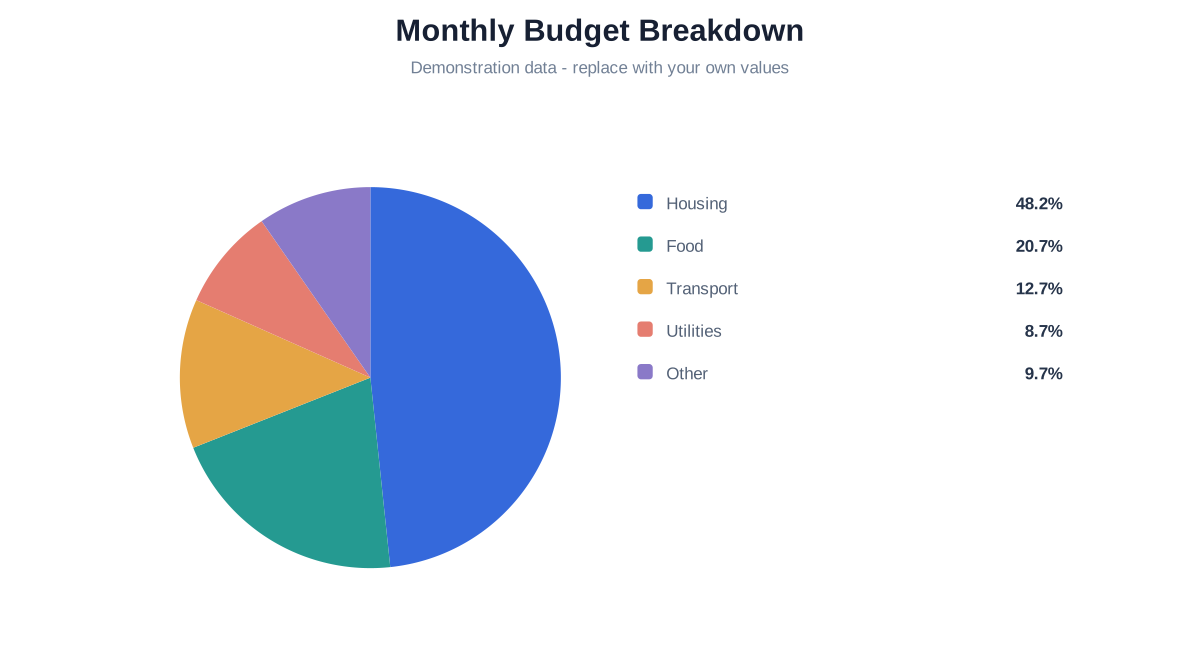
See how several expenses divide one fictional monthly budget, then replace every category and amount with your own.
Personal Finance
Open the complete editable project
See how several expenses divide one fictional monthly budget, then replace every category and amount with your own.
Demonstration data: Fictional household categories and amounts; not financial guidance or survey data.
Opens Pie Chart Maker using one-time browser storage. Viewing this page does not change saved drafts.
SOURCE DATA
Sample table
These are the exact values used by the preview and transferred to the editor.
Category
Amount
Housing
1450
Food
620
Transport
380
Utilities
260
Other
290
Use this budget template
Edit the category names and non-negative amounts. The pie renderer calculates each share from the total; the source values do not need to be percentages.
Use a bar chart instead when exact differences matter more than the parts-of-whole relationship. Download the result as SVG, PNG, JPEG or PDF, or keep an editable project JSON.