Compare categories from a zero baseline
Bar length represents magnitude, so the renderer keeps zero in the numeric domain. Positive bars extend above the baseline and negative bars below it without changing the source values.
Use a horizontal bar chart for long labels and grouped bars when every category contains several named series.
Arrange a bar graph table
Use one text category column and one numeric value column. Keep units consistent across rows and identify them in the title, subtitle or column name.
A histogram is different: it starts with raw numeric observations and calculates continuous intervals rather than displaying named categories.
Edit and download
Change values, title, palette, gridlines and axis labels while the SVG updates. Spreadsheet paste and browser-local CSV/XLSX import are available.
Download image formats, protected source CSV or the editable project JSON without sending the table to the server.
Start with a bar graph template
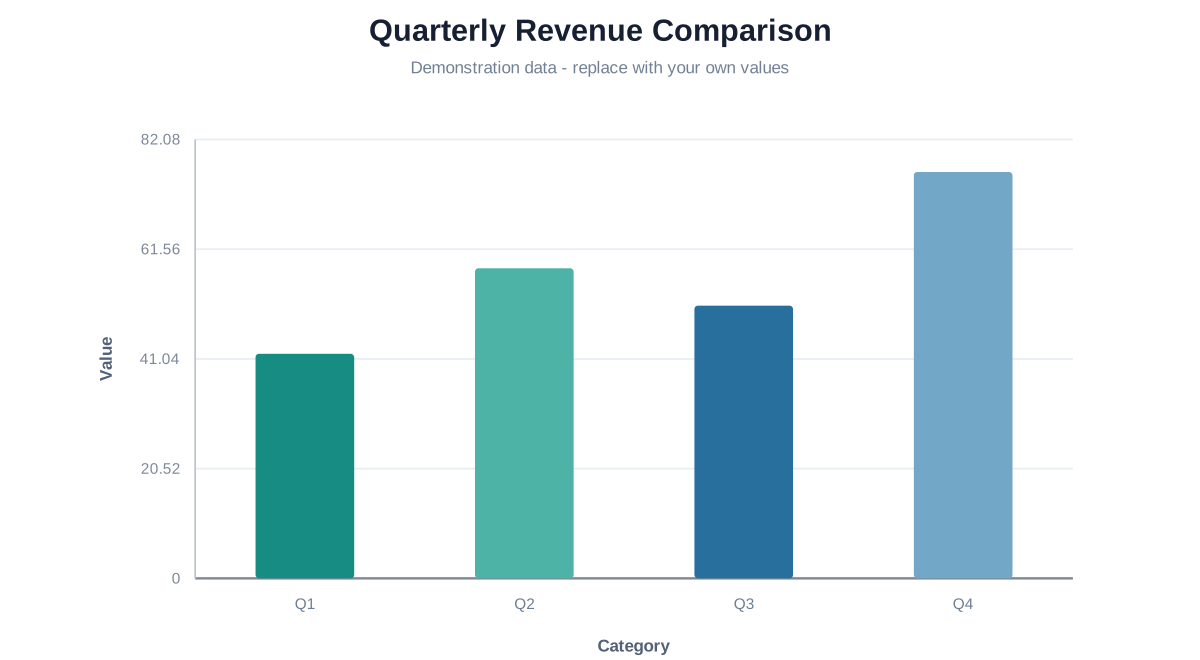
Quarterly Revenue Comparison
Compare four demonstration quarters on a common zero baseline and replace the values with figures in one consistent unit.
Questions about bar graphs
Because viewers compare bar lengths; a truncated baseline can exaggerate differences.
Yes. The signed scale places them on the opposite side of zero.
A bar graph compares named categories; a histogram bins raw numeric observations into adjacent intervals.