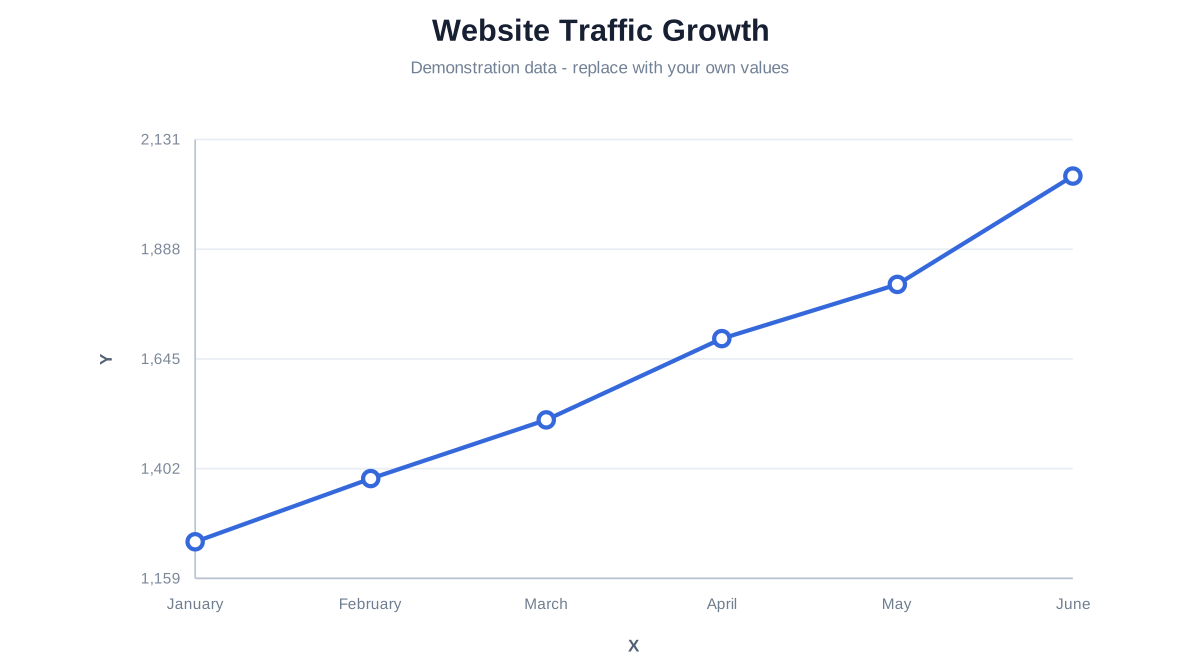
EDITABLE LINE GRAPH MAKER TEMPLATEWebsite traffic growth line graph template
Follow a fictional sequence of monthly visits and replace the ordered observations with your own traffic data.
MarketingOpen the complete editable project
Follow a fictional sequence of monthly visits and replace the ordered observations with your own traffic data.
Demonstration data: Fictional monthly visits; not analytics from a real website.
Opens Line Graph Maker using one-time browser storage. Viewing this page does not change saved drafts.
SOURCE DATASample table
These are the exact values used by the preview and transferred to the editor.
| Month | Visits |
|---|
| January | 1240 |
| February | 1380 |
| March | 1510 |
| April | 1690 |
| May | 1810 |
| June | 2050 |
Preserve the observation order
A line joins observations in X order. Keep categorical months chronological; numeric X values are placed proportionally by the renderer.
The slope shows change between adjacent observations, not a forecast or proof that one event caused another.
TEMPLATE FAQ
Using this example
Yes. Replace the X labels with ordered weeks and keep the Y values in one unit.
No. The series is fictional demonstration data.