Inspect relationships without inventing a line
Scatter plots reveal position, spread, clusters and possible association between two numeric variables. Equal coordinate pairs remain valid, although coincident marks may visually overlap.
A visible association does not prove that one variable causes the other. The editor does not calculate correlation, regression or automatic statistical conclusions.
Use two numeric columns
Place X in the first column and Y in the second. Both axes use numeric domains that include the supplied values, including negatives and zero.
Use Bubble only when each observation also has a meaningful non-negative size variable; do not invent one to decorate the chart.
Export exact source pairs
Edit or import the coordinates locally, adjust gridlines and labels, then download the chart. Source CSV preserves every pair and project JSON preserves the full editable state.
Text labels are not a third scatter coordinate; use a different data model when observation names are essential.
Start with a scatter plot template
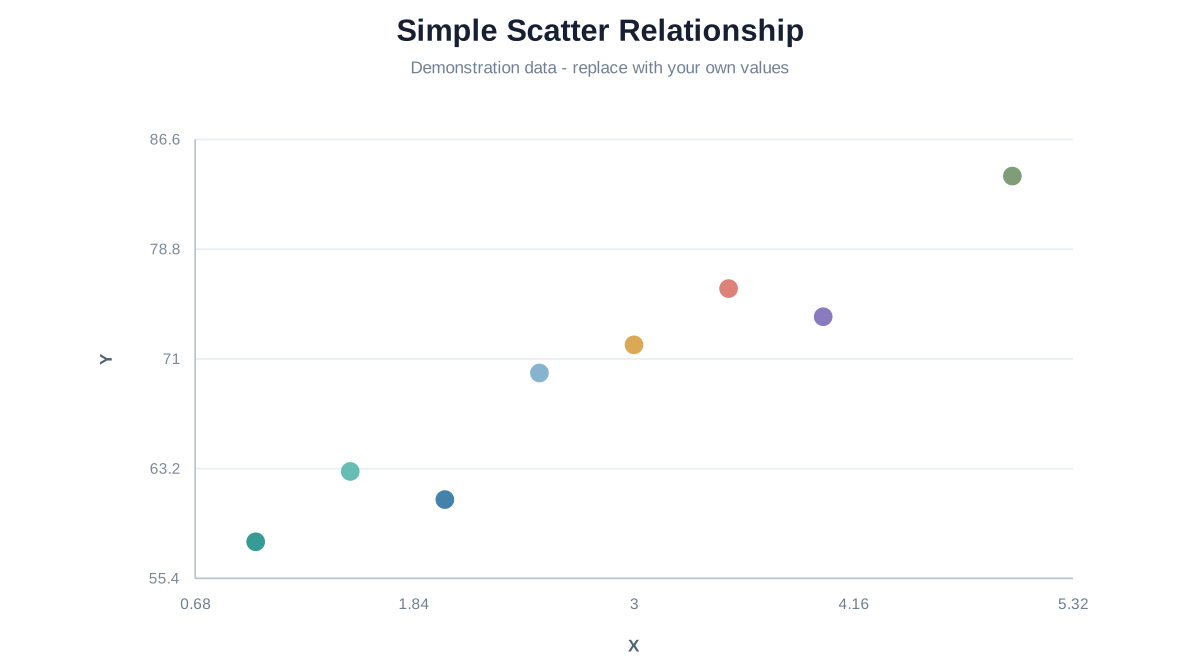
Simple Scatter Relationship
Explore how two fictional numeric variables appear together, then replace every X/Y pair with your own observations.
Questions about scatter plots
No. It renders the exact coordinates without statistical inference.
They remain separate source rows but may occupy the same visual position.
Bubble adds a third numeric magnitude encoded by circle area.