EDITABLE LINE GRAPH MAKER TEMPLATEScience experiment line graph template
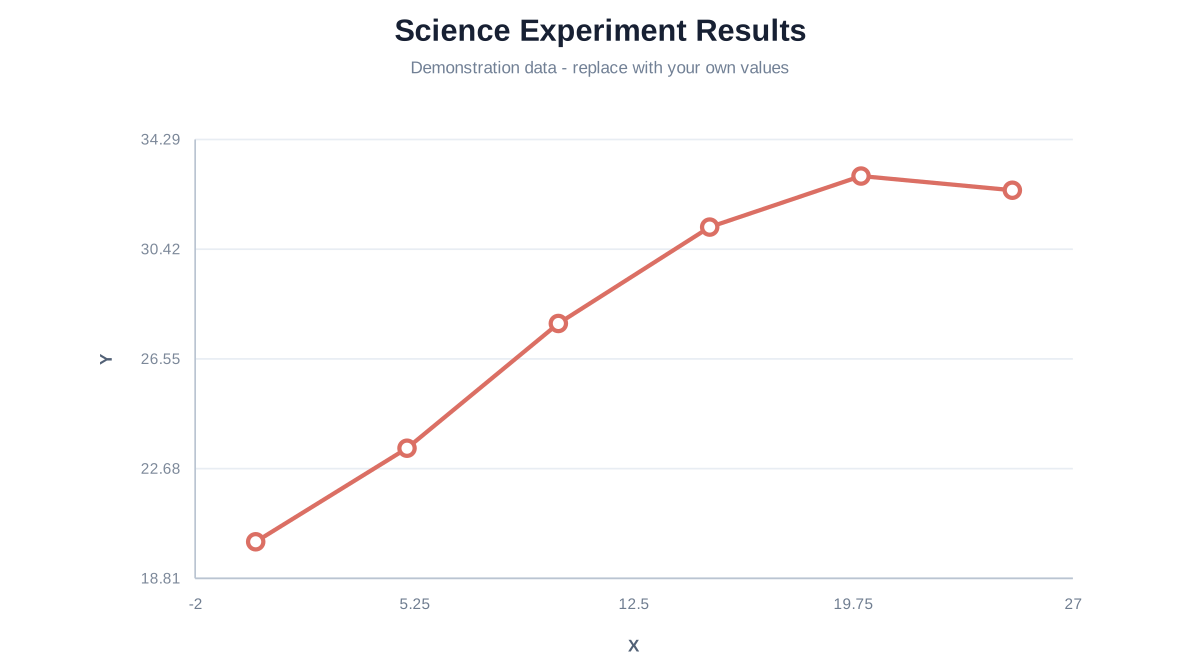
Replace the fictional step numbers and temperature measurements with observations from your own experiment, including the correct unit.
EducationOpen the complete editable project
Replace the fictional step numbers and temperature measurements with observations from your own experiment, including the correct unit.
Demonstration data: Fictional temperature readings; no experiment was performed and no scientific conclusion is claimed.
Opens Line Graph Maker using one-time browser storage. Viewing this page does not change saved drafts.
SOURCE DATASample table
These are the exact values used by the preview and transferred to the editor.
| Step (minutes) | Temperature (°C) |
|---|
| 0 | 20.1 |
| 5 | 23.4 |
| 10 | 27.8 |
| 15 | 31.2 |
| 20 | 33 |
| 25 | 32.5 |
Label variables and units
The X column contains ordered measurement times and the Y column contains one measured variable. Numeric X values are spaced proportionally.
A connected pattern summarizes these fictional observations only. Describe your method and uncertainty separately when using real experimental data.
TEMPLATE FAQ
Using this example
No. The temperature values are fictional demonstration measurements.
Yes. Rename the column and title so the displayed unit matches your data.