Prepare task dates and progress
Each row needs a task, valid ISO YYYY-MM-DD start and end dates, and progress from 0 to 100. The end date is inclusive, so a task with matching dates occupies one calendar day.
Overlapping ranges appear concurrently. The time scale adapts across day, week, month and year densities without changing stored dates.
Know the planning boundary
This editor visualizes the schedule you enter. It does not calculate dependencies, critical path, resource allocation, working-day calendars or automatic rescheduling.
Use Timeline for point events; use Gantt when duration and overlap are central to the task.
Keep calendar data portable
ISO dates remain timezone-independent strings in Project Format v2. Paste or import compatible tables locally, edit task names and progress, and export the complete SVG including dynamic rows.
Project JSON preserves dates and display settings for later editing.
Start with a gantt chart template
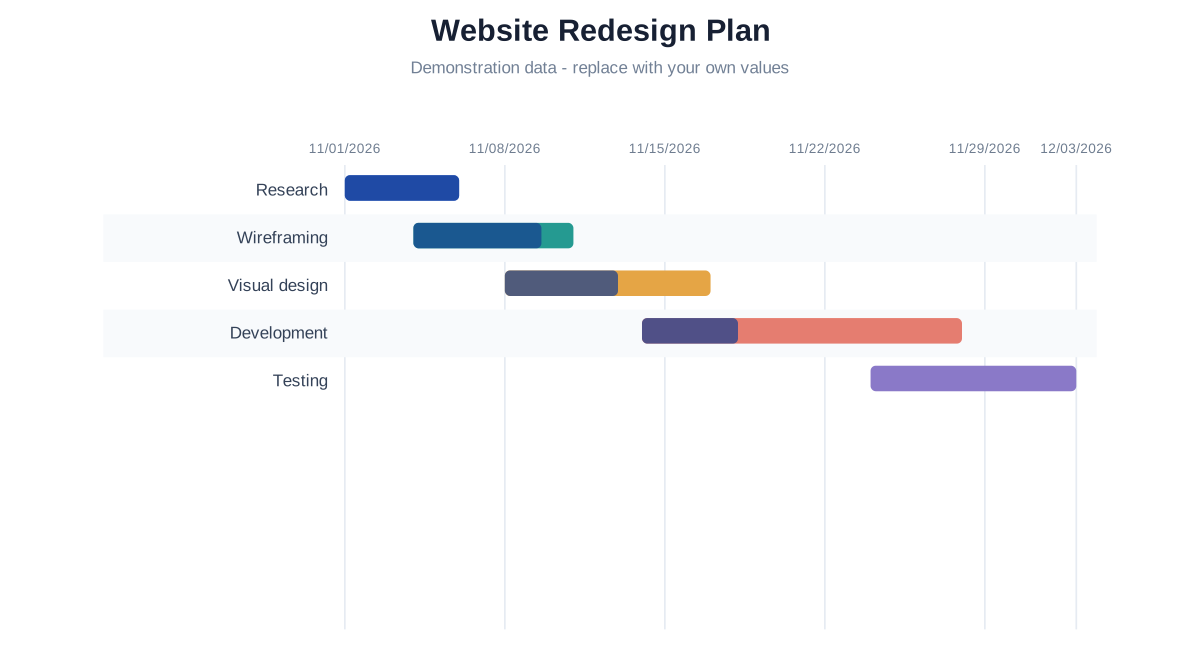
Website Redesign Plan
Plan a fictional redesign with overlapping tasks, inclusive start/end dates and editable completion percentages.
Questions about gantt charts
Yes. A task includes its entered end calendar date.
No. It renders explicit tasks, ranges and progress without dependency scheduling.
Yes. Every task uses the same proportional calendar domain.