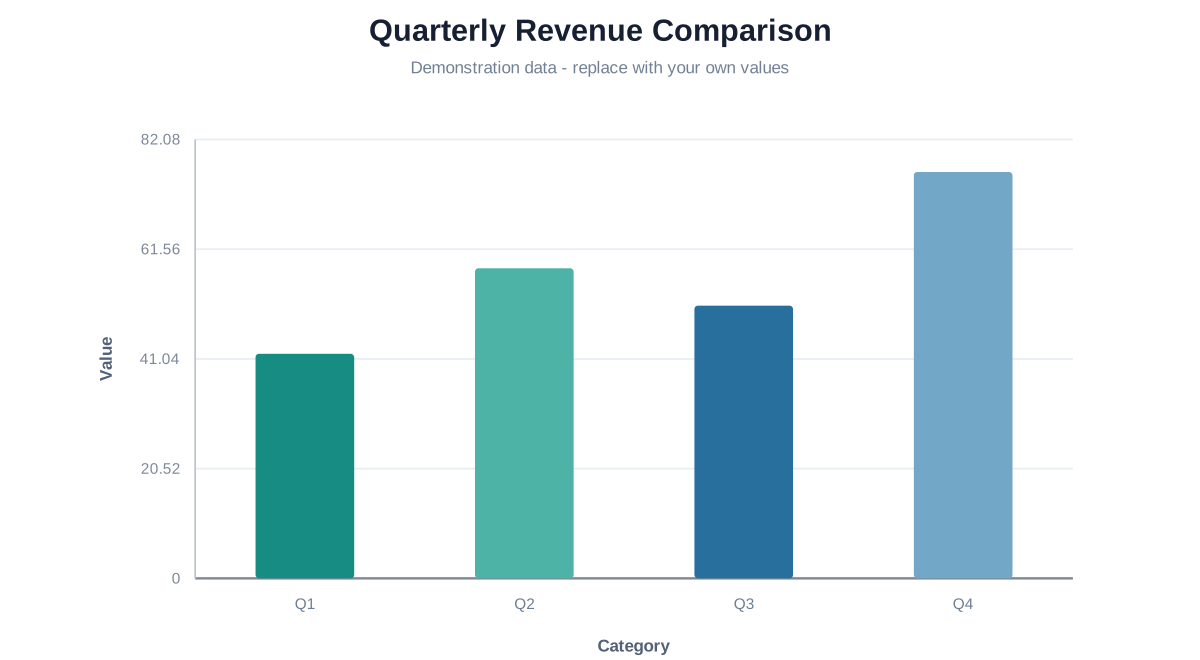
Compare four demonstration quarters on a common zero baseline and replace the values with figures in one consistent unit.
Business
Open the complete editable project
Compare four demonstration quarters on a common zero baseline and replace the values with figures in one consistent unit.
Demonstration data: Fictional quarterly values in illustrative thousands; no real company is represented.
Opens Bar Graph Maker using one-time browser storage. Viewing this page does not change saved drafts.
SOURCE DATA
Sample table
These are the exact values used by the preview and transferred to the editor.
Quarter
Revenue (thousands)
Q1
42
Q2
58
Q3
51
Q4
76
Compare quarters consistently
Keep every value in the same unit. Bars use a zero-inclusive scale so their lengths remain proportional, including when your data contains negative values.
Rename the title and categories, edit the values, then export the finished comparison or its source CSV.