Start with observations, not prepared bins
Each row is one raw numeric observation. The renderer determines intervals and counts every valid value exactly once, using right-open bins except for the inclusive final edge.
A bar chart instead expects named categories and already supplied values; it does not calculate a distribution.
How automatic binning works
Automatic mode uses the Freedman–Diaconis width when the sample spread and IQR support it. The IQR calculation uses quantiles internally for bin width; it does not turn the histogram into a Box Plot.
If that rule is not usable, Sturges supplies a bounded fallback. A manual bin count from 1 to 50 is also available.
Interpret shape carefully
Compare concentration, spread, gaps and tails, while remembering that bin boundaries affect appearance. A frequency bar reports how many observations fall in an interval.
Import raw columns from CSV or XLSX locally and export the rendered chart, original observations or Project v2 state.
Start with a histogram template
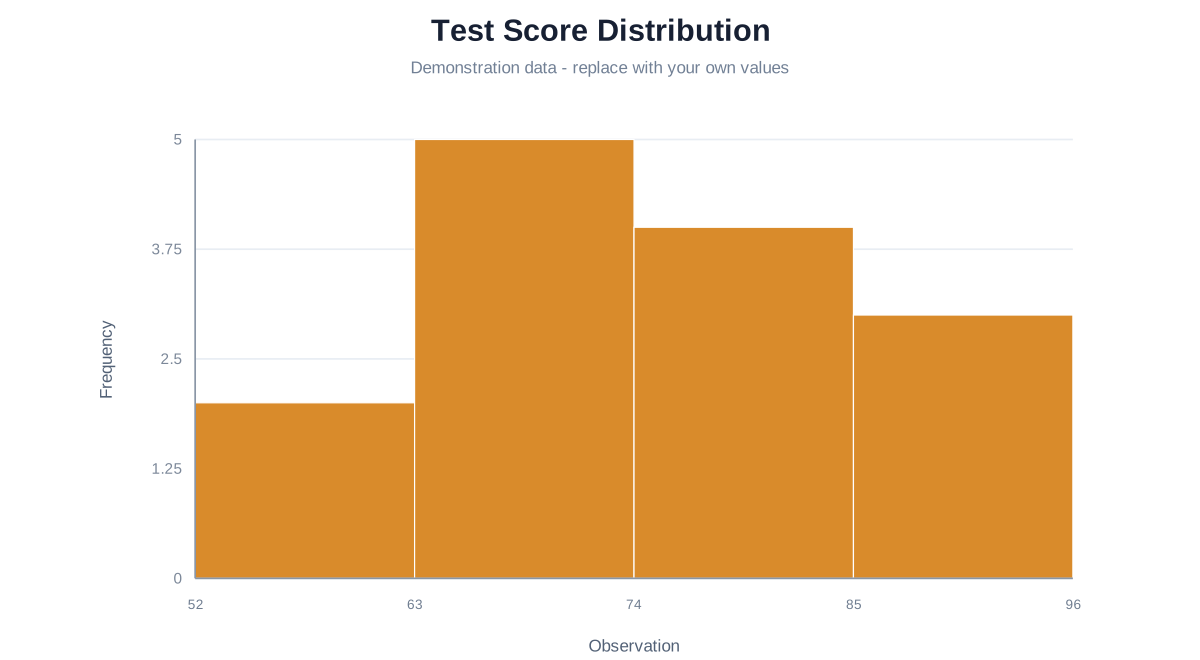
Test Score Distribution
Inspect the shape of fictional raw scores. ChartMaker groups observations into bins; the source table intentionally contains no precomputed frequencies.
Questions about histograms
No. Enter raw observations; the renderer calculates interval frequencies.
Freedman–Diaconis is used when possible, with Sturges as the documented fallback.
Changing interval width changes how observations are grouped, so compare choices rather than treating one view as automatic proof.