When a pie chart fits the question
Use a pie chart when every category is part of one meaningful total and the number of slices stays small enough to compare. The renderer divides each value by the sum and rounds displayed percentages while preserving a 100% total.
Choose a bar chart when exact differences, negative values or many categories matter more than the whole.
Prepare category and value data
Put one category in the first column and one finite, non-negative value in the second. Zero values are retained but do not create a visible angle; at least one value must be greater than zero.
Values may be counts, amounts or already measured quantities. They do not need to be entered as percentages.
Customize and export
Change the palette, legend, percentage labels, title and subtitle. Import CSV, TSV, TXT or XLSX locally, or paste cells from a spreadsheet.
Export a standalone SVG, PNG, JPEG or raster-backed PDF, source CSV, or the complete editable Project Format v2 JSON.
Start with a pie chart template
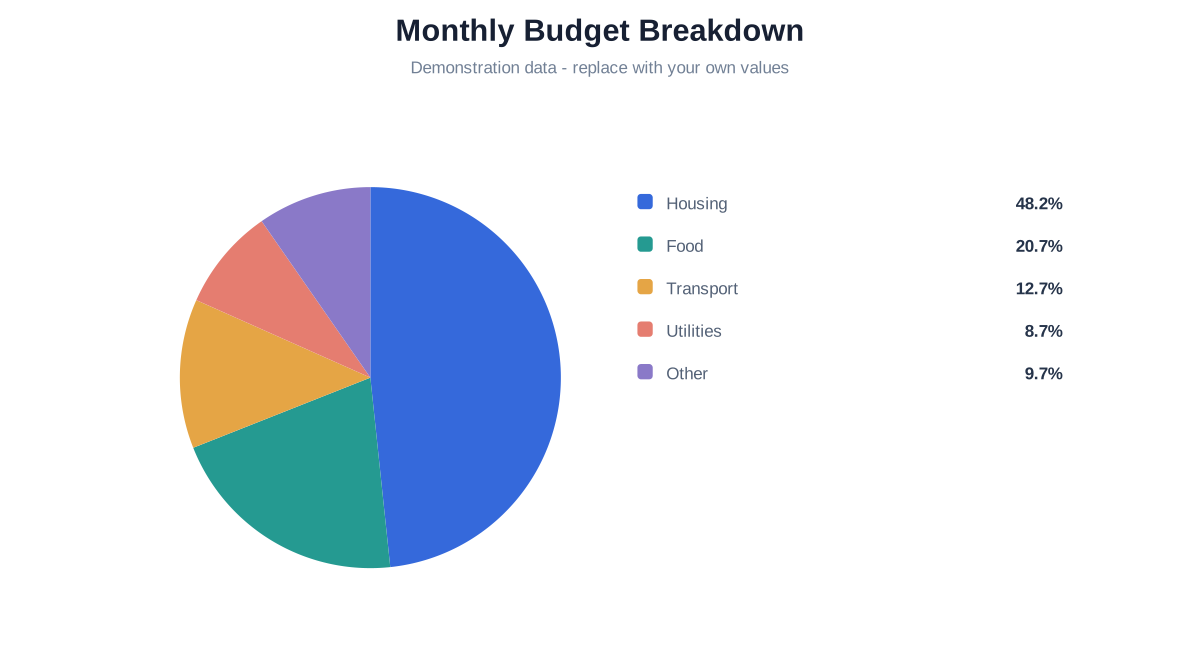
Monthly Budget Breakdown
See how several expenses divide one fictional monthly budget, then replace every category and amount with your own.
Questions about pie charts
No. Percentages are calculated from the sum of the entered values.
No. A negative part has no meaningful sector angle; use a signed bar chart instead.
Bars are clearer for precise comparisons, many categories or signed values.