Separate relative changes from absolute anchors
A change row adds its signed value to the previous running level. A subtotal or total row is an explicit absolute anchor at the entered value; it is not added again.
Connectors show how one level leads to the next. Positive and negative changes retain their signs and positions.
Prepare Step, Value and Type
Use clear step labels, finite signed values and one of the supported types: change, subtotal or total. Include an opening total when the bridge starts from an existing amount.
Use a normal bar chart when categories are independent rather than sequential contributions to a running value.
Verify and export the bridge
Edit rows and inspect the resulting levels before downloading. CSV retains the explicit step types, while project JSON preserves settings and editable semantics.
The editor performs the documented running calculation but does not provide accounting validation or financial advice.
Start with a waterfall chart template
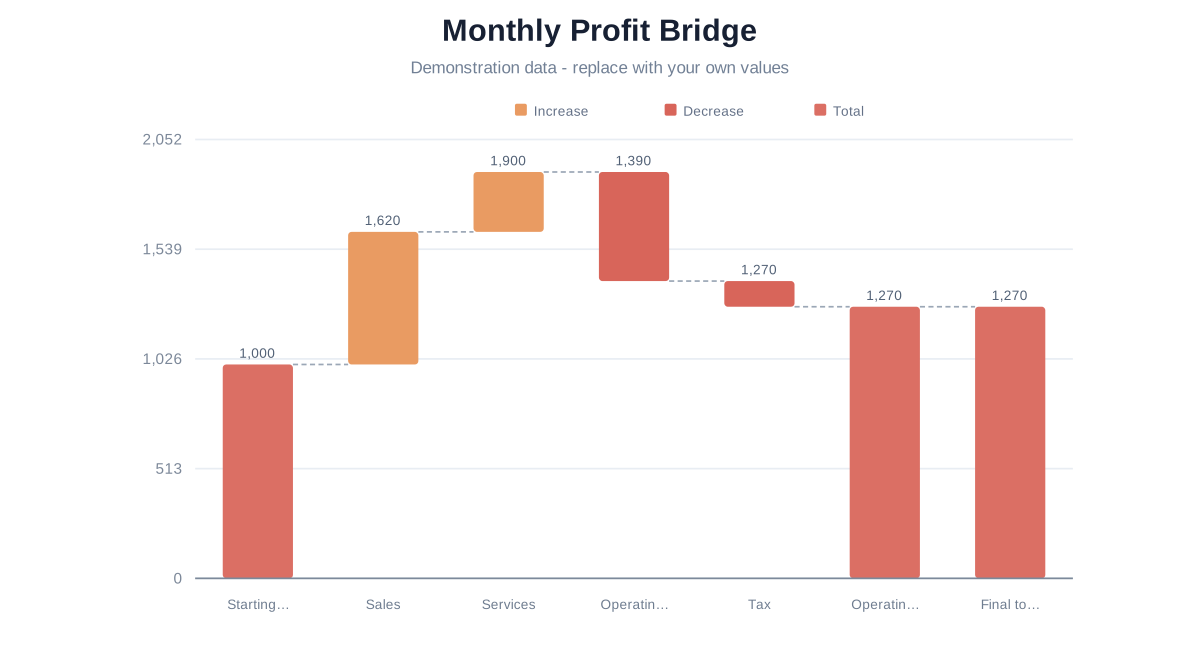
Monthly Profit Bridge
Follow fictional positive and negative changes from an opening value to an explicit subtotal and closing total.
Questions about waterfall charts
It adds the signed value to the previous running level.
Its entered value becomes an absolute anchor rather than another addition.
Yes. Negative changes lower the running level.