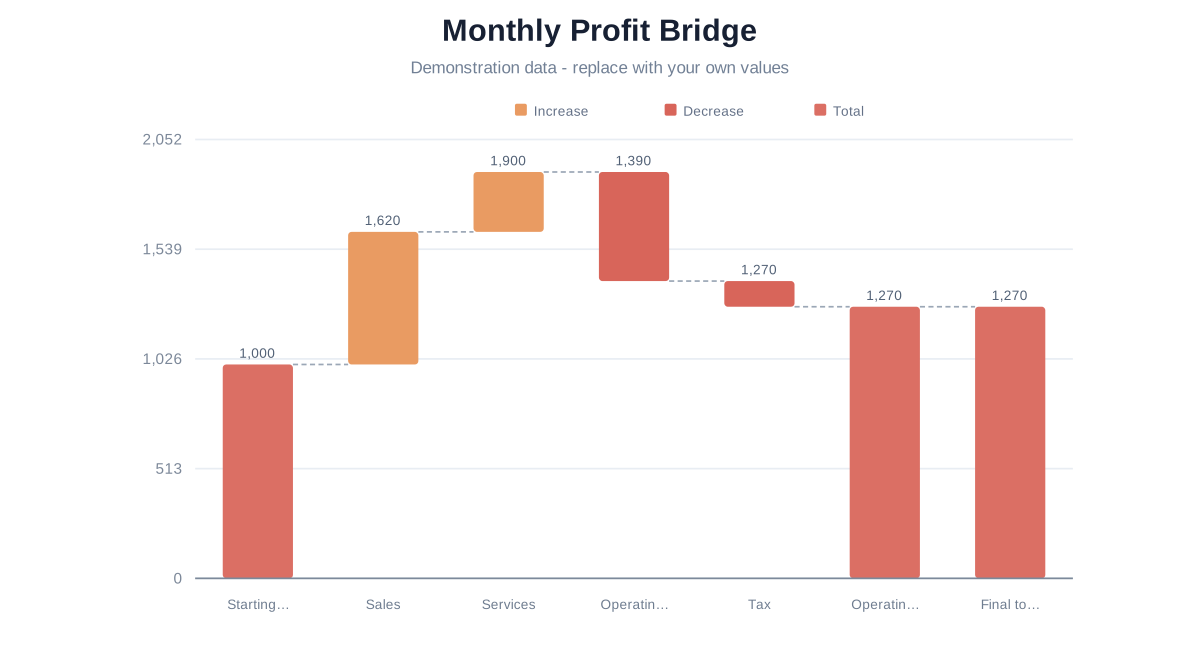
Follow fictional positive and negative changes from an opening value to an explicit subtotal and closing total.
Business
Open the complete editable project
Follow fictional positive and negative changes from an opening value to an explicit subtotal and closing total.
Demonstration data: Fictional financial labels and values; not an accounting statement or financial advice.
Opens Waterfall Chart Maker using one-time browser storage. Viewing this page does not change saved drafts.
SOURCE DATA
Sample table
These are the exact values used by the preview and transferred to the editor.
Step
Value
Type
Starting value
1000
total
Sales
620
change
Services
280
change
Operating costs
-510
change
Tax
-120
change
Operating subtotal
1270
subtotal
Final total
1270
total
Distinguish changes from absolute anchors
Change rows add signed values to the running total. Subtotal and total rows are explicit absolute anchors, so their source value must equal the intended level.
Use ordinary bars when you only need independent category comparisons rather than a running bridge.