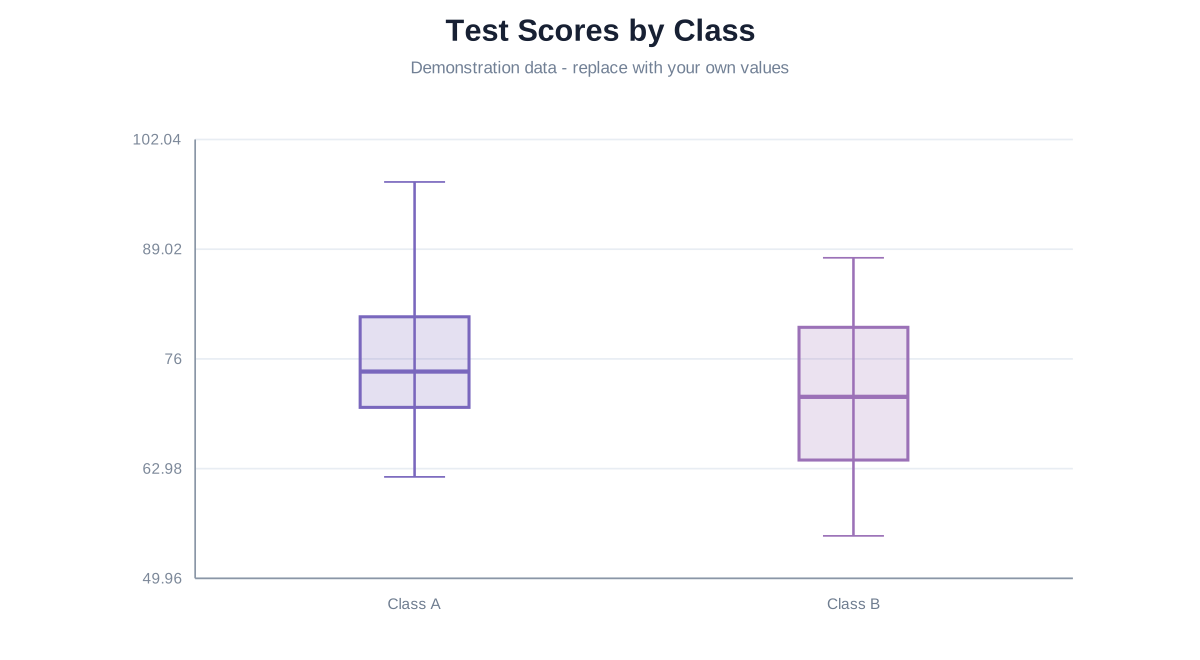
Compare the distribution of fictional raw scores in two groups using the renderer’s documented quartile and outlier rules.
Statistics
Open the complete editable project
Compare the distribution of fictional raw scores in two groups using the renderer’s documented quartile and outlier rules.
Demonstration data: Fictional raw scores; no real class performance or personal data is included.
Opens Box Plot Maker using one-time browser storage. Viewing this page does not change saved drafts.
SOURCE DATA
Sample table
These are the exact values used by the preview and transferred to the editor.
Class A
Class B
62
55
68
61
71
65
73
69
76
74
80
79
84
82
97
88
Read the five-number structure carefully
The renderer calculates the median and R7 quartiles from raw observations. Tukey fences use 1.5 times the IQR, while whiskers end at the most extreme actual values inside those fences.
Points outside the fences are shown as outliers. An outlier is a value to examine, not automatically an error.