Show change across an ordered sequence
A line connects adjacent observations, so row order matters for categorical X values. Numeric X values are stably sorted and spaced according to their actual distance.
Use Scatter when the task is to inspect independent numeric X/Y pairs rather than emphasize a connected sequence.
Prepare X and Y columns
The first column contains an ordered category or finite numeric X; the second contains a finite Y value. Avoid duplicate numeric X positions when a single ordered sequence is intended.
State the unit and preserve chronological order for month, date or step labels. The editor does not infer missing observations or forecast future values.
Work locally and export
Edit points, gridlines, axis labels, palette, title and subtitle. Import spreadsheet files or delimited text through the shared local parser.
Export the rendered SVG and raster formats, the source data, or a reusable Project v2 file.
Start with a line graph template
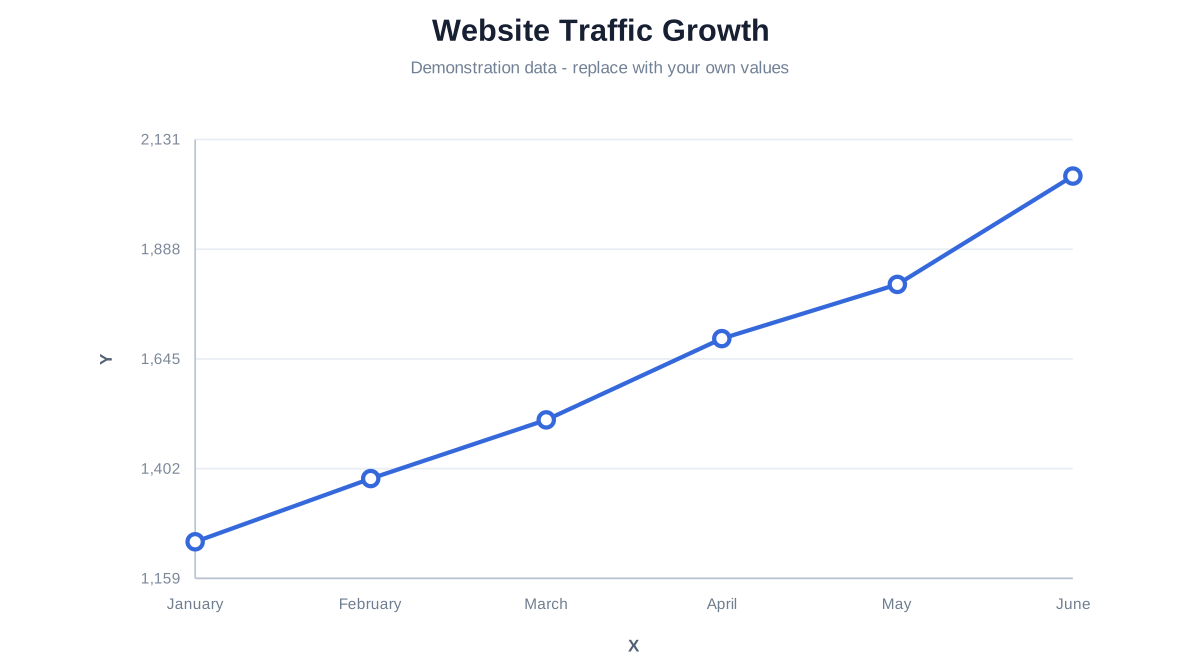
Website Traffic Growth
Follow a fictional sequence of monthly visits and replace the ordered observations with your own traffic data.
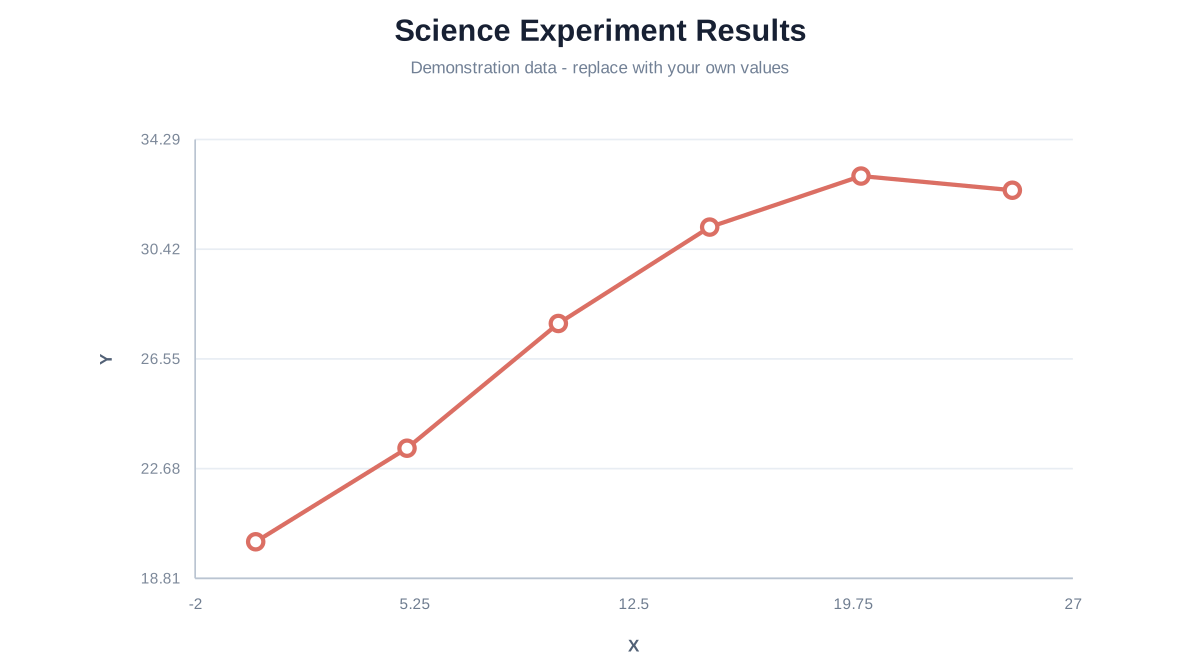
Science Experiment Results
Replace the fictional step numbers and temperature measurements with observations from your own experiment, including the correct unit.
Questions about line graphs
Yes. Fully numeric X input uses a linear scale; categorical labels preserve row order.
No. It connects only the observations you provide.
Choose Scatter when both coordinates are independent numeric measurements and connection order is not the message.