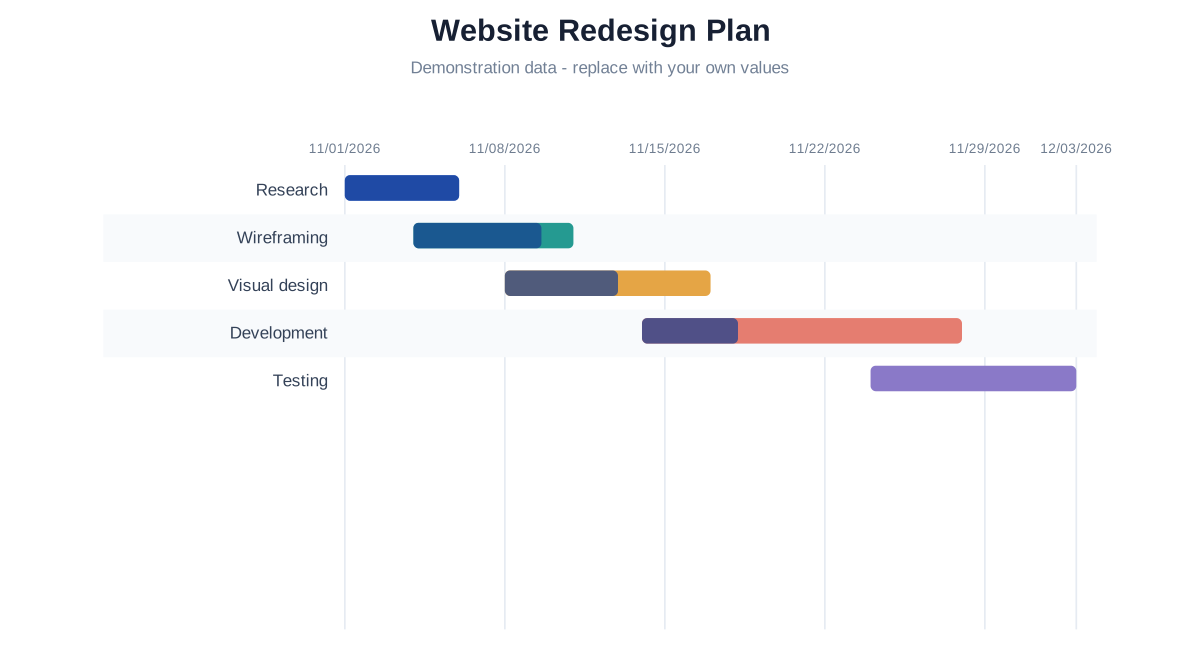
Plan a fictional redesign with overlapping tasks, inclusive start/end dates and editable completion percentages.
Planning
Open the complete editable project
Plan a fictional redesign with overlapping tasks, inclusive start/end dates and editable completion percentages.
Demonstration data: Fictional tasks, dates and progress; not a real project plan.
Opens Gantt Chart Maker using one-time browser storage. Viewing this page does not change saved drafts.
SOURCE DATA
Sample table
These are the exact values used by the preview and transferred to the editor.
Task
Start Date
End Date
Progress
Research
2026-11-01
2026-11-05
100
Wireframing
2026-11-04
2026-11-10
80
Visual design
2026-11-08
2026-11-16
55
Development
2026-11-14
2026-11-27
30
Testing
2026-11-24
2026-12-02
0
Edit an inclusive calendar plan
Dates use ISO YYYY-MM-DD and the end date is included in a task’s duration. Overlapping bars show concurrent work; progress must remain between 0 and 100.
This chart does not calculate dependencies, critical paths, resources or an automatic schedule.