Understand the calculated summary
The median divides the ordered observations. Q1 and Q3 use the R7 quantile method, and the box spans their interquartile range.
Tukey fences sit 1.5 IQR below Q1 and above Q3. Whiskers end at the most extreme actual observations inside those fences; values beyond them are drawn as outliers.
Compare groups from raw values
Each column is an observation group, not a row of precomputed quartiles. Add or rename group columns and keep missing cells empty rather than replacing them with zero.
An outlier is a point that meets the displayed rule, not automatically a data mistake or a reason to delete the observation.
Edit and export the evidence
Import compatible columns from spreadsheets or delimited files. The source table remains available alongside the accessible SVG.
Download the visualization, source CSV or project JSON so the raw observations and group names remain reviewable.
Start with a box plot template
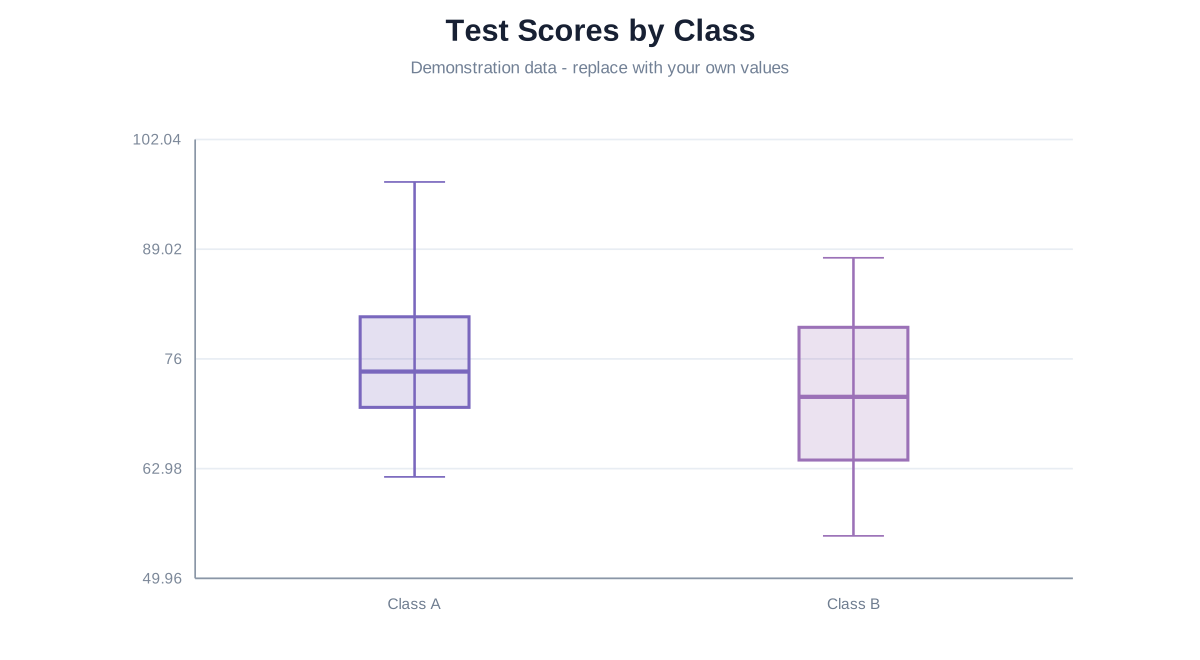
Test Scores by Class
Compare the distribution of fictional raw scores in two groups using the renderer’s documented quartile and outlier rules.
Questions about box plots
R7, the documented linear interpolation method used by the renderer.
At the most extreme observed values within the Tukey 1.5 IQR fences.
Not necessarily. They are observations outside the displayed fences and need contextual investigation.