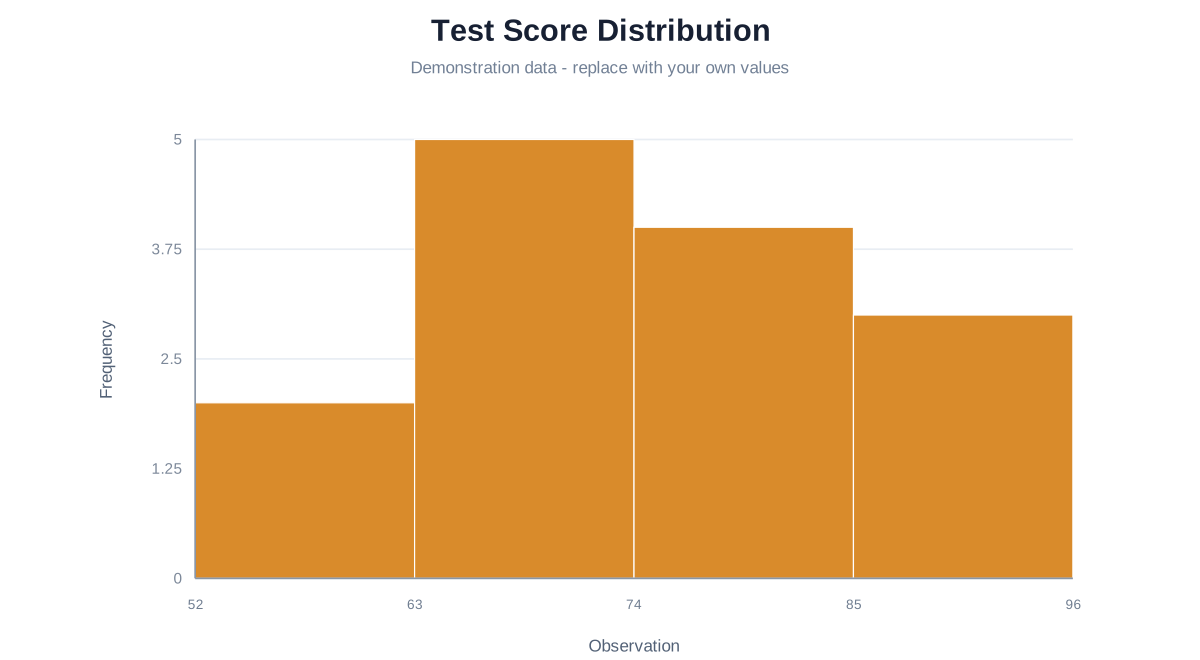
Inspect the shape of fictional raw scores. ChartMaker groups observations into bins; the source table intentionally contains no precomputed frequencies.
Statistics
Open the complete editable project
Inspect the shape of fictional raw scores. ChartMaker groups observations into bins; the source table intentionally contains no precomputed frequencies.
Demonstration data: Fictional raw scores; not a real cohort, assessment or research dataset.
Opens Histogram Maker using one-time browser storage. Viewing this page does not change saved drafts.
SOURCE DATA
Sample table
These are the exact values used by the preview and transferred to the editor.
Score
52
61
64
67
69
72
72
74
78
81
83
87
91
96
Start with raw observations
Automatic bins use the Freedman–Diaconis width when possible and fall back to Sturges when the spread does not support it. You can also set a manual bin count.
A histogram describes frequency across numeric intervals. It does not compare named categories like a bar chart.