Show a compact part-to-whole view
Each visible angle equals value divided by the positive total. Zero values remain in the table but create no angle; negative values are invalid.
Use the hole without hiding the data
Hole size changes the ring geometry, not the percentages. A thinner ring leaves less area for direct comparison, so keep labels and legend readable.
Know when Pie or Bar is clearer
Pie uses the same proportion mathematics without a hole. Bar is better for many categories, signed values or precise magnitude comparison.
Start with a doughnut chart template
Personal Finance · Pie Chart Maker
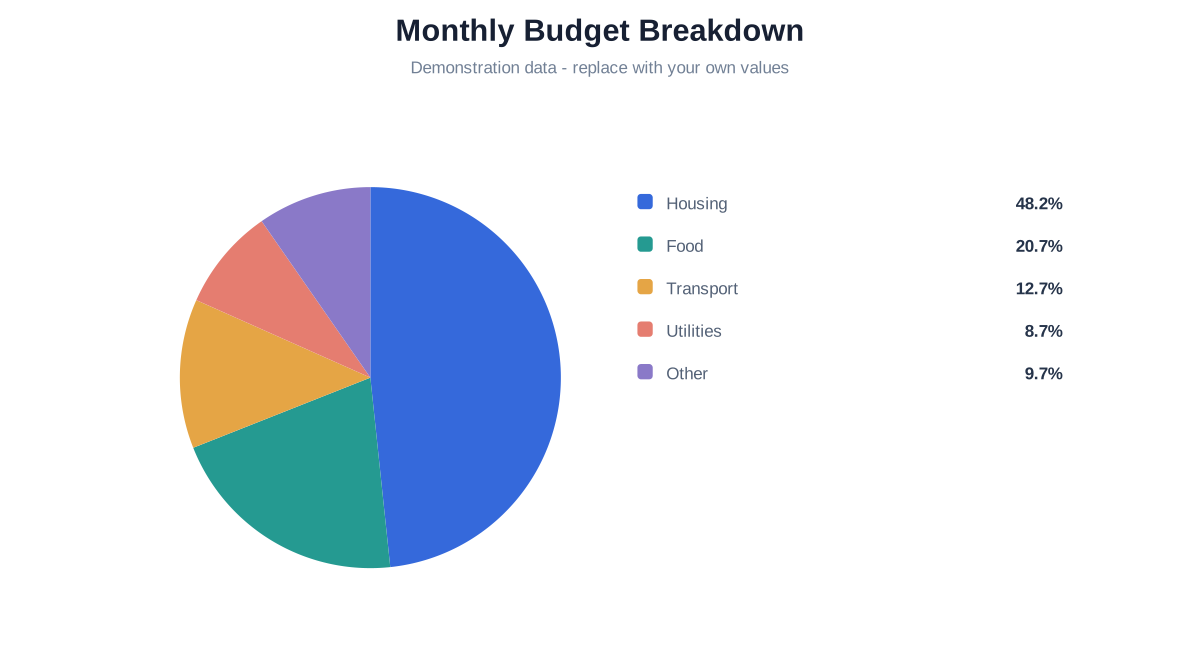
Monthly Budget Breakdown
See how several expenses divide one fictional monthly budget, then replace every category and amount with your own.
Related guides
CHART FAQ
Questions about doughnut charts
No; shares are calculated from their sum.
No.
No; use Bar instead.