Read the two endpoints
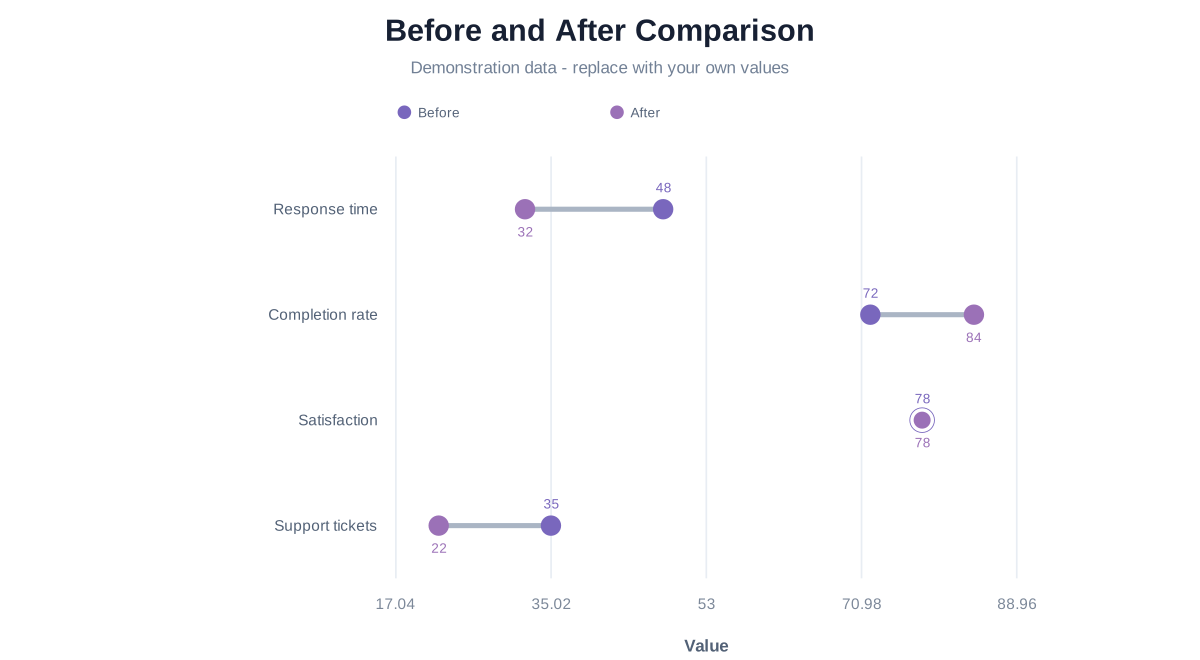
Every category has stable Before and After values. The connector spans their exact scaled positions and a tie remains visible as coincident markers.
Compare distance and direction
The horizontal gap represents the signed difference on one shared scale. Large gaps deserve contextual interpretation rather than an automatic improvement claim.
Dumbbell versus Slope
Dumbbell emphasizes distance; Slope emphasizes direction. Their shared paired-values model supports lossless switching.
Start with a dumbbell chart template
Business · Dumbbell Chart Maker
Before and After Comparison
Edit paired values for each category and keep exact before/after endpoints on one common scale.
Related guides
CHART FAQ
Questions about dumbbell charts
Both endpoints occupy the same coordinate with distinct marker styling.
Yes, including pairs that cross zero.